To access the river flows pages, click the River Flows link in the header of a Dreamflows page, and select the report of interest. The most-visited flow page is the Realtime page.
Three drop-down menus and a Go button appear just below the page header, default Standard page values shown here:

Together, they control the content and display format of the flow information being presented:
- Zone selects the geographical area being reported (e.g. California/Nevada or Northwest States or All States).
- Report determines the time span and type of data being reported (Realtime, Latest, Daily or Fantasy).
- Format selects the display format (Standard, Compact or Map).
Clicking on the
 icon brings you to this help page.
For more detailed information on each field, click here.
The disclaimer is printed in the gray area between the navigation menus and the list of Dreamflows sponsors. It gives pertinent information about the quality of the information presented on the page, and is specific to the data presented on that page. It should be read in conjunction with the "Estimate Information" section near the bottom of the flow report.
Both are intended to be taken literally. Please heed them!
Each flow report page contains a number of sections. Some, like California North Coast on the realtime page, report flow information. Others, like Key to Symbols, contain supporting information.
For example, the realtime flow report has the following Section Index:
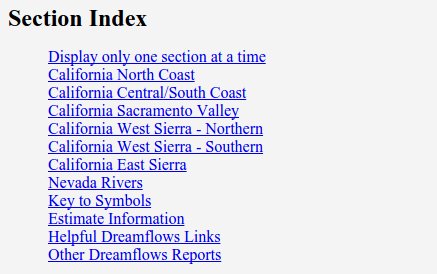
The Section Index is always displayed. By default, for Standard flow reports, the contents of all the corresponding sections are displayed too.
Clicking on the Display only one section at a time link in the Section Index causes only the first section of data to be displayed (in this case California North Coast). The first link then changes to Display all sections at once. Click again to revert back to display-all-sections-at-once mode.
Whether only one section is displayed, or all are, clicking on some section name (e.g. California West Sierra - Northern) takes you to that section.
At the end of each flow data section there are two entries, Display only this section and Return to Section Index, for example:
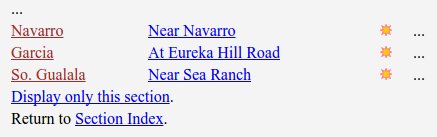
Clicking on Display only this section causes only that section to be displayed. At this point the link changes to Display all sections at once. Click again to revert back to display-all-sections-at-once mode.
The Return to Section Index link takes you back to the Index. From there you can select a different section, which often provides a quicker/easier way to navigate than scrolling up and down the page.
The advantage of the display-all-sections-at-once mode is that all data is downloaded at once, and thereafter navigation between sections is quick and easy. The downside is that a lot of data is downloaded up front, which on a slow connection can take a while.
The advantage of the display-one-section-at-a-time mode is that data for only the selected section is downloaded. The downside is that each time a new section is selected, the old page is discarded before the new section is downloaded (takes time).
So either way, there may be performance considerations. However in modern browsers on modern desktops (lots of memory and lots of bandwidth) which mode you select is usually a matter of preference.
The precise contents of a line of flow data on a Standard format flow report
depends on the report (Realtime, Latest, Daily or Fantasy).
However, they can all be broken up into three logical areas.
The following snapshot shows each area outlined in red:
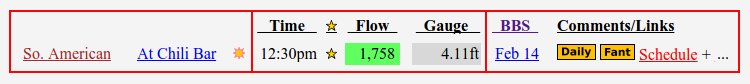
From left to right:
- Gauge Name, Weather Icon
- River Flow Information
- Additional Info
This area (outlined in red in the following snapshot) deals with the gauge name, the weather icon, and associated links:
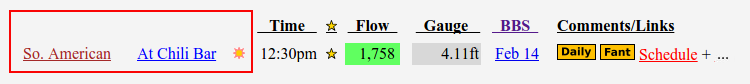
This gauge's full name is So. American - At Chili Bar, formed as a hyphen-separated combination of the first two fields.
Dreamflows normally refers to a given gauge by its full name.
However, in what follows the three fields are described separately. From left to right:
- River Name (in this example: So. American), is the river/creek/stream that the gauge is on. This field has a brown link; clicking on it takes you to the cross-listing page, which provides information on which runs are associated with this gauge, plus basic run beta, links to online guidebooks, and more.
- Gauge Location (in this example: At Chili Bar), is the location of the gauge on this river/creek/stream. This field has a blue link; clicking on it takes you to the most-recent flow graph for this gauge, which in turn has links to other graphs and pages. Sometimes there will be a qualifier to the right of Gauge Location, e.g. (est), (rough), (sched), (fant), etc. See the Estimate Information section, at the bottom of the flow report page you're visiting, for information on how to interpret these qualifiers. Click on the (est) or (rough) link to provide feedback on the accuracy of the estimate.
- Weather Icon (sun in this example), is a generalized icon representing the latest weather forecast for this gauge location that Dreamflows has information for. Click on the icon for the full NOAA weather forecast (all weather forecasts are by their nature best guesses, however Dreamflows has found over the years that NOAA forecasts are the most specific and reliable).
This area (outlined in red in the following snapshot) shows flow information specific to the Realtime flows report:
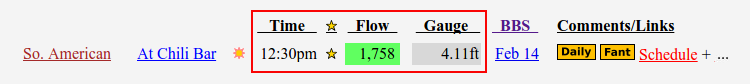
This entry says that at 12:30pm today, the flow on the South Fork American River at the Chili Bar gauge was 1,758 cfs.
The corresponding gauge height was 4.11 feet.
Because 1,758 cfs is generally considered an optimum flow for this gauge, the flow field is color-coded green and has a star next to it. If flow information in cfs weren't available but gauge height was, then the gauge value would be color-coded instead. See the color-coding section for more information.
Note that the Realtime report shows only flow values for today. If no flow information is displayed, you may still get useful flow information by clicking on the blue Gauge Location link (described above) or clicking on the yellow Daily icon (described below).
This area (outlined in red in the following snapshot) shows flow information specific to the Latest flows report:
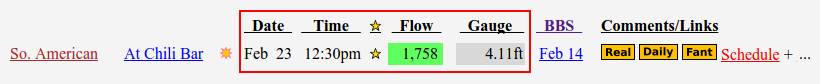
This entry says that at 12:30pm on Feb 23, the flow on the South Fork American River at the Chili Bar gauge was 1,758 cfs.
The corresponding gauge height was 4.11 feet.
Because 1,758 cfs is generally considered an optimum flow for this gauge, the flow field is color-coded green and has a star next to it. If flow information in cfs weren't available but gauge height was, then the gauge value would be color-coded instead. See the color-coding section for more information.
Note that the Latest report shows only the latest-available flow values within the last seven days. If no flow information is displayed, you may still get useful flow information by clicking on the blue Gauge Location link (described above) or clicking on the yellow Daily icon (described below).
This area (outlined in red in the following snapshot) shows flow information specific to the Daily flows report:
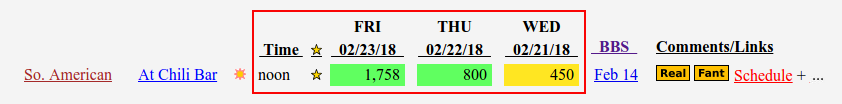
This entry says that at noon on Feb 23, the flow on the South Fork American River at the Chili Bar gauge was 1,758 cfs,
and that on the previous two days (also more-or-less at noon) it was 800 cfs and 450 cfs respectively.
Showing flows for three consecutive days like this helps to show flow trends at a glance, which is particularly useful during snowmelt.
If flow information in cfs weren't available for this gauge but height was, then gauge heights would be listed instead.
Because 1,758 cfs is generally considered an optimum flow for this gauge, the flow field is color-coded green and has a star next to it. Note that the star refers only to the left-most (most recent) displayed flow entry. Since 800 cfs is still considered a good flow it's color-coded green, but 450 cfs is considered low so it's color-coded yellow. See the color-coding section for more information.
Some gauges - mostly on reservoirs - report only daily average flow, computed from midnight to midnight. In that case, the Time field shows avg.
This area (outlined in red in the following snapshot) shows flow information specific to the Fantasy flows report:
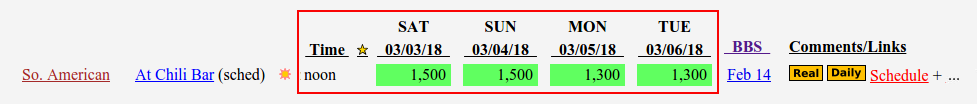
This entry predicts that the noon flow on the South Fork American River at the Chili Bar gauge will be 1,500 cfs on Mar 3 and 4,
and 1,300 cfs on Mar 5 and 6.
Note that those are only the noon flows - click on the Gauge Location field (blue link) for a graph showing expected duration,
or the Schedule link on the right side for more detail.
Because 1,500 cfs and 1,300 cfs are both considered good flows for this gauge, the flow fields are all color-coded green. See the color-coding section for more information.
The qualifier to the right of the Gauge Location field tells you how to interpret the prediction, as follows:
- (sched) - this says the flow in the river is expected to be at least the stated scheduled flow. See this graph help page entry for information on how to interpret scheduled-release data like this.
- (fant) - this says future flow in the river was computed using some kind of AI/heuristic/statistical model. These predictions are sometimes dead on, but are often pure fantasy. See this graph help page entry for information on how to interpret predictions like these. See this Fantasy Flows help page for other commentary on Fantasy Flows.
Most of the examples on this page show a flow of 1,758 cfs for the So. American - At Chili Bar gauge, so this section uses 1,758 cfs as an example flow. The same principles apply to other flows, though.
Because 1,758 cfs is generally considered a good flow for this gauge, the flow field is color-coded green. Because 1,758 cfs is also considered at or near optimum flow, it has a star next to it.
See the Key to Symbols section, at the bottom of the flow report page you're visiting, for a key to what other color codes mean and how they're represented.
Note that the So. American - At Chili Bar gauge serves the Chili Bar, C to G, and The Gorge runs. So, the color-coding of this single gauge is of necessity a compromise between the three runs. To access more accurate per-run color-coding, do one of the following:
- Click the River Name (brown) link on the far left side of the data line (the So. American link in this example),
then when on the cross-listing page click the Trigger Levels icon which looks like
 .
This will show you what levels are considered good/optimum for each of the runs associated with this gauge.
.
This will show you what levels are considered good/optimum for each of the runs associated with this gauge.
- Visit the Map flow page and visually see what the color-coding is.
- Visit the Alpha Reaches Page and visually see what the color-coding is.
This area (outlined in red in the following snapshot) shows additional information specific to this gauge:
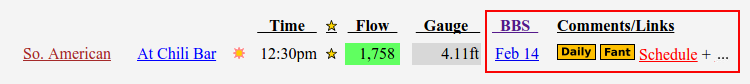
The BBS entry (Feb 14 in this case) provides a link to the Dreamflows bulletin board.
The resulting list of posts are all specific to (or at least associated with) this gauge.
If you want to make a post for a specific gauge then clicking on this link is a great way to do it, since (if you tell it to) the bulletin board will automatically link your post to this gauge.
See this help page for more information on how to interpret BBS field entries and/or how to make new posts.
The Comments/Links column has a mix of additional links and useful information:
The  icon (if present) will take you to this gauge's entry on the Realtime report page.
The  icon (if present) will take you to this gauge's entry on the Daily report page.
The  icon (if present) will take you to this gauge's entry on the Fantasy Flows report page.
The  icon (if present) will take you to this gauge's entry on NOAA's River Forecast Center page.
Any water temperature or paddle out information is for the time specified in the Time column.
Entries like "Rising 3 cfs/hr", "Falling 32 cfs/hr", or "Slope is zero" on the report give the computed instantaneous rate of change of flow, based on the most recent information for this gauge. It alerts you to the general trend (rising or falling and whether by a lot or a little), but please take it as a warning or fun fact, rather than a firm prediction. Gauge inaccuracies and transmission blips can give false readings, plus of course things can change at short notice. Click through to the flow graph for a clearer picture of what's actually going on.
Notices like Data are preliminary and subject to revision are there because the agency/utility supplying the information is doing so out of the goodness of its heart (truly), and doesn't want liability if the data proves inaccurate. However, this is still perfectly normal gauge data, and time has shown it's just as reliable in practice as other gauges.
Many gauges (particularly reservoir inflows) aren't reported on the Realtime page - because, well, the data isn't realtime. For convenience, this is spelled out with this message and link to the Daily report: See the daily report for flow information.
Estimate is outside the model's range of XXX-YYY cfs says this is a virtual gauge, and the estimating model can't compute flows with satisfactory accuracy. You can still click through to the graph to see what the estimate is, but be aware that it's more suspect than usual.
Flow currently unavailable means the gauge has a temporary glitch, or is seasonal, whatever, but in any case is expected to report flow again "soon".
Site currently not operational means the gauge is no longer reporting data, often due to lack of funding. However Dreamflows leaves it there as a placeholder in case it starts reporting again, plus associated info (like run beta) is usually still relevant.
The remaining links and information for scheduled releases, shuttles, permit information, flow estimate confidences, etc, should be self-explanatory.