To access the river flows pages, click the River Flows link in the header of a Dreamflows page, and select the report of interest. The most-visited flow page is the Realtime page.
Three drop-down menus and a Go button appear just below the page header, default Map page values shown here:

Together, they control the content and display format of the flow information being presented:
- Zone selects the geographical area being reported (e.g. California/Nevada or Northwest States or All States).
- Report determines the time span and type of data being reported (Realtime, Latest, Daily or Fantasy).
- Format selects the display format (Standard, Compact or Map).
Clicking on the
 icon brings you to this help page.
For more detailed information on each field, click here.
The disclaimer is printed in the gray area between the navigation menus and the list of Dreamflows sponsors. It gives pertinent information about the quality of the information presented on the page, and is specific to the data presented on that page. It should be read in conjunction with the "Estimate Information" section near the bottom of the flow report.
Both are intended to be taken literally. Please heed them!
On entering the map page, the information displayed is dependent on the selections made in the side panel (right of the map), described below.
Runs are displayed as color-coded 'tracks'
while gauges are displayed as color-coded 'balloons'

The possible color codes and their meanings are listed in the Key to Symbols section at the bottom of the map page.
The number of tracks and gauges currently displayed on the map is reported at the bottom of the side panel.
When you visit this page for the first time on a given browser, all checkboxes are checked, but only tracks (i.e. no gauges) are selected. Thereafter your settings are remembered from session to session.
To get basic information about a run or gauge, hover the mouse over its track or balloon. This will bring up a transient dialog box. Move the mouse to close the box.
To get more detailed information about a run or gauge, click on its track or balloon. This will bring up a dialog box which persists even after you move the mouse away; see the Pop-Up sections below for details on what each field means. Click the 'X' in the dialog box, or somewhere on the map, to close it.
The side panel controls what information is displayed. The first section determines what kinds of marker are drawn on the map (tracks, balloons, dotted lines, run marker lines). The remaining sections control which tracks or gauges are selected. Each section has the potential to limit the selection, so that a given track or gauge is displayed if, and only if, it passes all tests in all sections. Unless otherwise stated, the map is re-zoomed and re-positioned to fit the selected data each time you change your selection.
It is easy to end up with nothing selected and therefore nothing displayed. For instance there are no Class VI runs reported by Dreamflows in Nevada, and there are often no gauges (or runs) at optimum flow. If no gauges/tracks appear on the map (but you expect them to), check the selections in the side panel.
Reload Flow Data, Map Layout Controls
There's a series of buttons above the map side panel:
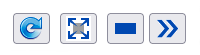
Click the
 button to re-load flow information.
All transient data (flows, weather icons, track and gauge color-codings, etc) is updated without redrawing or repositioning the map.
If you have a pop-up dialog box open at the time, its contents will be updated too.
While the data is loading, a circling image
button to re-load flow information.
All transient data (flows, weather icons, track and gauge color-codings, etc) is updated without redrawing or repositioning the map.
If you have a pop-up dialog box open at the time, its contents will be updated too.
While the data is loading, a circling image
 appears to the left of the reload button for about half a second (or until the data finishes reloading, if that takes longer).
Click the
 button to re-zoom and reposition the map to fit the selected data.
Use this when you've manually zoomed and/or moved the map and you want to get back to a high-level view.
button to re-zoom and reposition the map to fit the selected data.
Use this when you've manually zoomed and/or moved the map and you want to get back to a high-level view.
Click the
 button to hide everything on the map except the map itself.
The map is repositioned to the top of the browser viewport, and the button image changes.
Click the
button to hide everything on the map except the map itself.
The map is repositioned to the top of the browser viewport, and the button image changes.
Click the
 button to make the hidden information visible again.
Click the
 button to hide the side panel.
The map widens to match, and the button image changes.
Click the
button to hide the side panel.
The map widens to match, and the button image changes.
Click the
 button to make the side panel visible again.
When the mouse is hovered over a track, a transient pop-up dialog box appears, while clicking on the track brings up a persistent pop-up dialog box with more information.
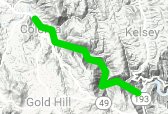
For example consider this snapshot of the South Fork American River:
To the right (color-coded yellow) is the Chili Bar run, in the center (color-coded green) is the C to G run, while on the left (color-coded yellow) is The Gorge run. On the far right is the balloon showing the location of the Chili Bar gauge.
The flow range for the Chili Bar gauge has been chosen to match the most popular runs in this section, which are Chili Bar and The Gorge, so in this case it's color-coded yellow to match. Nevertheless, the flow on the C to G run is considered good, so its track is color-coded green.
Hovering over the C to G track brings up this transient dialog box:
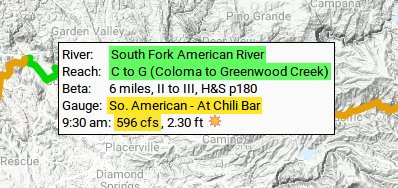
In this case, the River and Reach fields are color-coded green, since the flow is considered good for this particular run.
However, the Gauge field and corresponding flow (596 cfs) are both color-coded yellow to match the current Chili Bar gauge color.
Clicking on the C to G track brings up this persistent dialog box, which is the same as the hover box but with additional links:
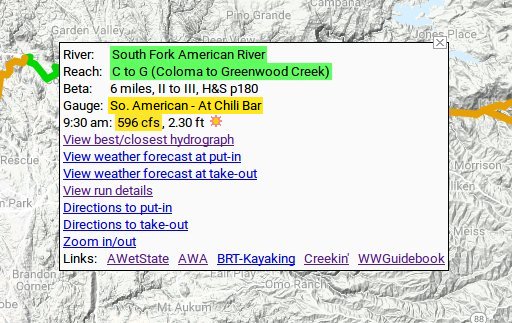
The meaning of the various fields and links is as follows:
- River - the name of the river or creek, e.g. South Fork American River or Cache Creek.
- Reach - the name of the run (or reach), e.g. Chili Bar or Rowboat Rapid Run.
- Beta - basic information about the run, including distance in river miles, the range of difficulty, and a guidebook reference.
- Gauge - the name of the gauge that the flow information is taken from. Note that the gauge needn't be particularly close to the run, or even in the same drainage - adjustments are made when color-coding runs and gauges so that they (hopefully) match up. Thus it could happen that a gauge far downstream from a given run is reporting a high flow so it's color-coded red, yet that high flow far downstream usually corresponds to a good flow on the run, so the run itself is color-coded green.
- Flow - a time and/or date, plus river flow in cfs (if available), plus gauge height in feet (if available), plus water temperature in Fahrenheit (if available), plus a weather icon. The flow, gauge and temperature information are for the specified date/time. The weather icon represents the most-recent weather information available to Dreamflows. Click on one of the forecast links (see below) for a full weather report.
- View best/closest hydrograph - click to bring up a hydrograph of this gauge.
- View weather forecast at put-in - click to access NOAA's latest weather report at put-in.
- View weather forecast at take-out - click to access NOAA's latest weather report at take-out.
- View run details - click to access the Dreamflow cross-listing page entry for this gauge/run combination.
- Directions to put-in - click to bring up Google Maps with the put-in location pre-populated; fill in your starting point to get directions.
- Directions to take-out - click to bring up Google Maps with the take-out location pre-populated; fill in your starting point to get directions.
- Zoom in/out - click to zoom in and get a closer look at the area. Click again to zoom back out to where you started from.
- Links - one or more links to online guidebooks and other resources that give useful information about the run.
When the mouse is hovered over a balloon, a transient pop-up dialog box appears, while clicking on the balloon brings up a persistent pop-up dialog box with more information.
For example consider this snapshot of the South Fork American River:
The balloon showing the location of the Chili Bar gauge is on the far right. The flow range for the gauge has been chosen to match the most popular runs in this section (Chili Bar and The Gorge), so the gauge balloon is color-coded yellow to match.
Hovering over the Chili Bar gauge balloon brings up this transient dialog box:
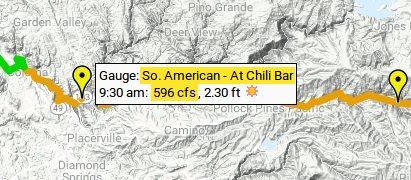
The dialog box appears just to the right of the gauge balloon, i.e. the balloon on the far right represents a different gauge. The Chili Bar gauge balloon is color-coded yellow since the flow on this section of the river is considered low.
In the pop-up, the Gauge field and its corresponding flow (596 cfs) are both color-coded yellow to match the Chili Bar balloon color.
Clicking on the Chili Bar gauge balloon brings up this persistent dialog box, which is the same as the hover box but with additional information:
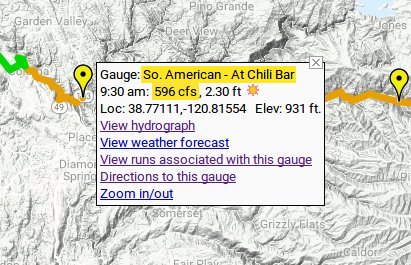
The meaning of the various fields and links is as follows:
- Gauge - the name of this flow gauge, in this case So. American - At Chili Bar.
- Flow - a time and/or date, plus river flow in cfs (if available), plus gauge height in feet (if available), plus water temperature in Fahrenheit (if available), plus a weather icon. The flow, gauge and temperature information are for the specified date/time. The weather icon represents the most-recent weather information available to Dreamflows. Click on the forecast link (see below) for a full weather report.
- Loc - the (approximate) location of the flow gauge.
- Elev - the (approximate) elevation of the bottom of the flow gauge relative to sea level.
- View hydrograph - click to bring up a hydrograph of this gauge.
- View weather forecast - click to access NOAA's latest weather report for the gauge location.
- View runs associated with this gauge - click to access the Dreamflow cross-listing page entry for this gauge.
- Directions to this gauge - click to bring up Google Maps with the gauge location pre-populated for you; fill in your starting point to get directions.
- Zoom in/out - click to zoom in and get a closer look at the area. Click again to zoom back out to where you started from.
The top section of the map side panel determines what kinds of marker/track are drawn on the map:
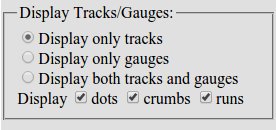
The meaning of the various radio buttons and checkboxes is as follows:
- Display only tracks - only run tracks are displayed (no gauge balloons). This is the default setting.
- Display only gauges - only gauge balloons are displayed (no run tracks).
- Display both tracks and gauges - if you're zoomed out then displaying both tracks and gauges gets busy and it can be hard to make out what's going on (which is why the default setting is tracks only). However, if you're zoomed in then most likely you will want to select Display both tracks and gauges at some point, so you can see the locations of the most relevant nearby gauges.
- Display dots - if enabled, dotted lines (where applicable) provide a visual path between runs and their associated gauges. These dots match the color of the associated gauge (red, green, yellow, blue or grey).
- Display crumbs - if enabled, another kind of dotted line (called crumbs here) provides a visual path between related runs if they are spaced apart, and sometimes between related drainages. These dots are a light purple.
- The logic for these two checkboxes is then as follows:
- Display dots unchecked - no dotted lines are displayed.
- Only Display dots checked - only dotted lines joining runs and associated gauges are displayed.
- Both Display dots and Display crumbs checked - both kinds of dotted line are displayed.
- Display runs - if enabled, and you are zoomed in far enough, short black run marker lines are drawn at the take-out/put-in points of adjacent runs. This is useful for showing where one run ends and another begins.
- Display dots, crumbs and runs are all track-related. So when Display only gauges is selected, all three checkboxes are disabled.
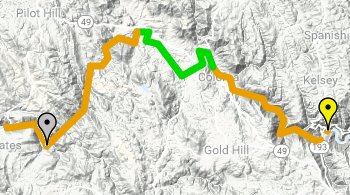
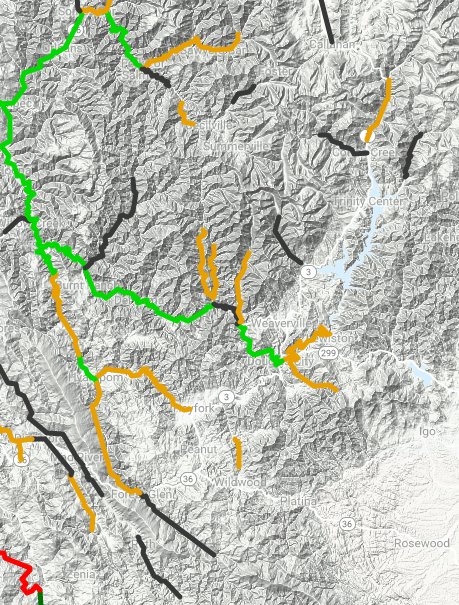
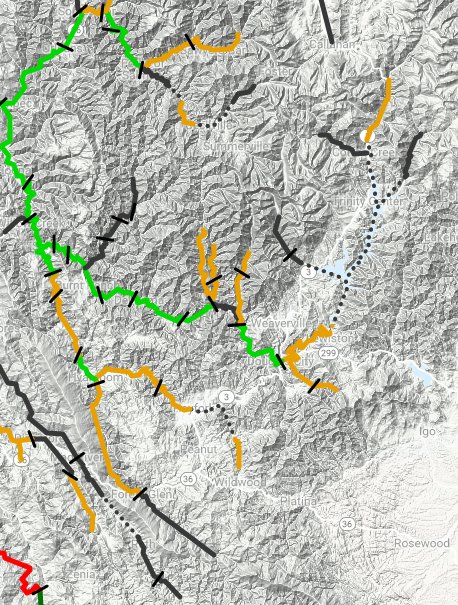
To illustrate dots/crumbs/runs, the map on the right (which has them all enabled) makes it easier to recognize drainages, see where rivers run, and distinguish
runs which are next to each other but have the same color-coding:
Which regions are listed depends on which zone you select.
The default is California/Nevada:
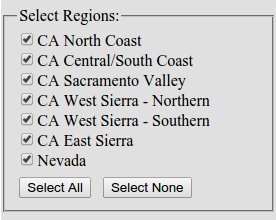
Select the regions you want displayed.
There can be overlap close to a state border
(for example the East Fork Carson is listed under both CA Sierra - East Slope and Nevada Rivers).
In the following, each class includes its variants, i.e. IV matches IV-, IV and IV+.
Class I includes Flatwater:
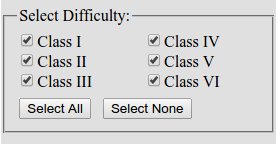
If all checkboxes are checked then all runs are selected, even those which don't have a known difficulty rating.
Otherwise, only runs matching the checked items are selected.
For example a run which is rated Class II+ to IV (V) will be selected if Class II, or Class III, or Class IV is checked. However, checking Class V won't by itself cause the run to be selected, since the (V) is a warning and not part of the difficulty rating (it's expected that most will portage the class V, thereby making the run II+ to IV).
Conversely, if you checked only Class II and Class V, then only Class II and Class V runs are selected. You might want to do this if you have Class II and Class V paddlers in your group and you're looking for runs appropriate for both sub-groups.
When Display only gauges in the top section is selected, then no tracks are displayed, so the Select Difficulty section is disabled.
In the following, both gauges and tracks are selected based on their current color-coding:
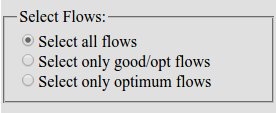
The meaning of each radio button is as follows:
- Select all flows - all gauges and tracks are selected, whatever their current color coding. Even gauges and tracks which have no known flow range and therefore no color coding are selected.
- Select only good/opt flows - only gauges and tracks which are at least at good flow are selected.
- Select only optimum flows - only gauges and tracks which are at optimum flow are selected.
In the following, both gauges and tracks are selected based on their name:
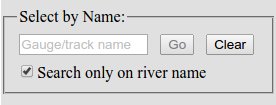
Enter an appropriate search string in the text box, then click the
Go button.
For illustration, assume you've entered American Slab in the text box and that the Search only on river name checkbox is not checked.
Then:
- If all of the words in the search string are contained in a given gauge or track name, then it is selected. For example, So. American - Below Slab Creek Dam is selected since it contains both American and Slab. Conversely, So. American - At Chili Bar isn't selected since it doesn't contain Slab.
- The word comparison is case-insensitive, i.e. american matches American.
- Order is unimportant, so both american slab and slab american match So. American - Below Slab Creek Dam.
- On the other hand, words need to match exactly, and wildcards are not supported, so neither amer nor amer* matches American.
- You may replace common gauge name abbreviations with the corresponding full word:
This helps to match gauge names with corresponding run names. For instance, entering East Carson matches both the gauge E. Fk Carson - Near Markleeville and the run East Fork Carson River - Markleeville to Gardnerville (Hangmans Bridge to Route 395).Abbrev. Full Word No. North Mi. Middle So. South E. East W. West - Omit parentheses, quotes and slashes from your search string. To match Narrows/Frogtown enter Narrows Frogtown. To match ("The Upper") enter The Upper. To match Devil's Canyon enter Devils Canyon.
In the following, both gauges and tracks are selected based on their distance from a location that you specify:
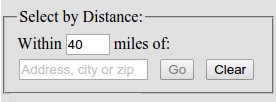
Note: this is the distance "as the crow flies", not distance by road.
Enter an appropriate address, city name or ZIP code in the text box, then click the
Go button.
The entry needs to be unique within the Western U.S. or the system will complain.
For example, just "Auburn" isn't specific enough, but "Auburn, CA" is.
To reduce absurdities which would result from entering very small, very large, or invalid values, the distance value is limited to the range 10 to 2000 miles.
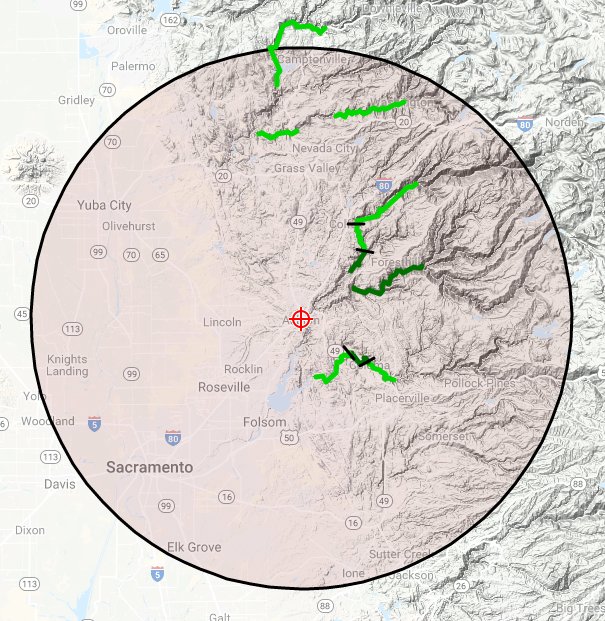
The following shows gauges and tracks within 40 miles of Auburn, CA.
A circle of radius 40 miles is drawn on the map, with the  icon marking Auburn.
Gauges which lie within the circle, and tracks whose put-in or take-out are within the circle, are selected:
icon marking Auburn.
Gauges which lie within the circle, and tracks whose put-in or take-out are within the circle, are selected:
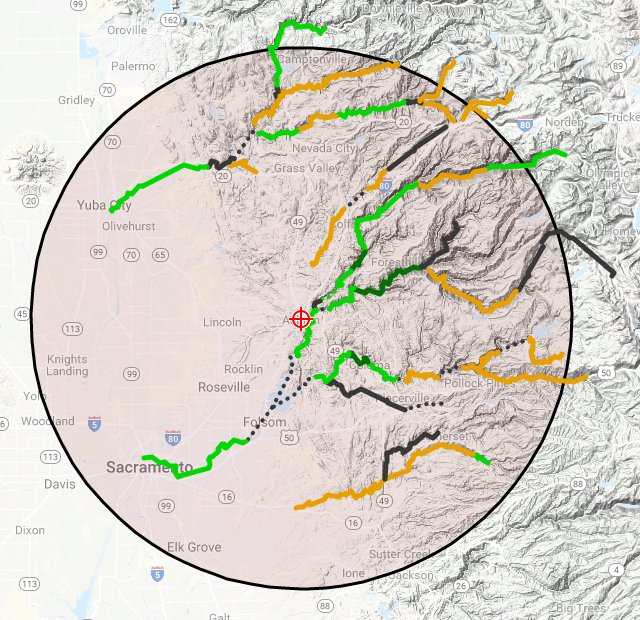
For the above search, we selected Display crumbs so we could see how tracks related, but wanted an uncluttered look so didn't Display runs, nor did we display gauges.
The following builds on the previous 40-mile search around Auburn, CA, but selects
- only Class III and IV runs
- at good/opt flows.
Crumbs are designed to link up related runs, but since only some runs are displayed crumbs would be confusing. To avoid this we unchecked Display crumbs. However, we want to locate individual runs now, so checked Display runs.
The Dreamflows mapping system is oriented toward conventional desktop computers with keyboard and mouse. It was developed (and extensively tested) using Firefox on Ubuntu, and tested on Chrome, Safari and Opera.
It also works fine on IE11 when not in Compatibility View. [Compatibility View tells Microsoft browsers to not be standards compliant, which bad behavior we don't want here].
The conclusion is that the mapping system will work on any modern standards-compliant browser. If you have a browser which doesn't work as expected, suggest upgrading.
The following are known issues:
- The Dreamflows mapping system uses Leaflet to draw the maps, balloons, etc.
The library redraws the map as it zooms from one map view to another, which produces a pretty cool effect when the Internet connection is fast enough.
However, if you have a slow Internet connection (dialup, or over VPN or whatever) you get to see the redraws in slo-mo and it may not look so cool.
Suggest waiting patiently as the balloons get tiny, then huge, then normal, and the picture gets blurry then sharp.
Eventually the redraws will stop and the end result should be as expected.
- The Dreamflows mapping system is oriented toward conventional desktop computers with keyboard and mouse. Operation with touch-screen devices like the iPad and smart phones may be limited.
Issues only get fixed when they're known, so: if you notice any other issues, please contact chris@dreamflows.com. Thanks!